Proportional relationships on a graph
So far, we have represented proportional relationships or simply equivalent ratios using tables and equations. Using these tables and equations, we can have one more way to represent these relationships. A GRAPH!
Here is a table for the red and yellow paint needed to make a shade or orange from our previous lessons.

The equation for this is y = 5r.
Using the value for red paint and yellow paint as the two coordinates x and y, we can plot the points on a coordinate plane. Let’s use the first four rows and see how it looks.

We connect the dots and get a straight line which passes through the origin and continue on.
Let’s think of a few equivalent ratios to red and yellow paint - 4:20, 5:25, 7:35. Not that the x axis is written as the first term in the ratio. When we plot all these on the graph as well, we see that they too lie on the line we made before. So, the coordinates of any point that lies on this line are all equivalent ratios!
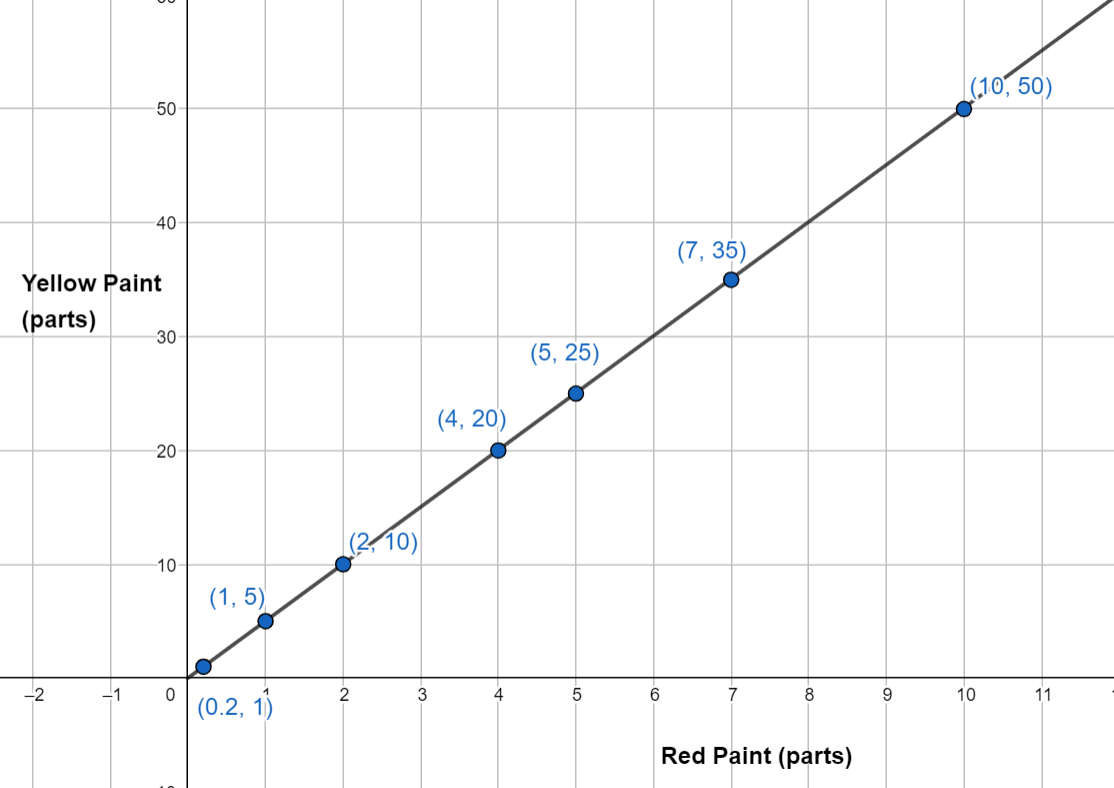
We do not necessarily need to join these points since some points in between, like decimal points may not make sense for some situations like when we’re talking about the number of people. They would still be correct but would not make sense in the context.
Are all straight-line graphs proportional?
Let’s see an example for a graph that is straight like the one above but does not start or pass from the origin.
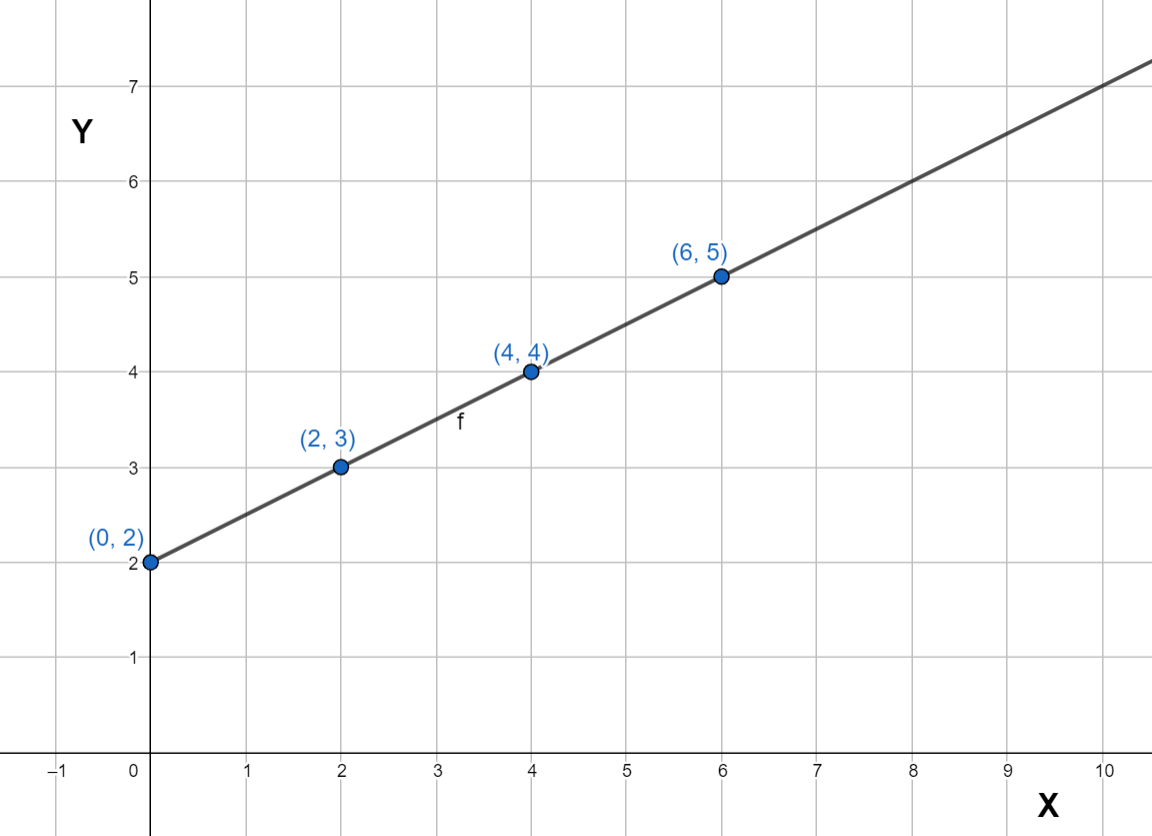
Some of the ratios we get are 0:2, 2:3, 4:4, 6:5. We see that they are not equivalent ratios and do not have the same relationship. So, this graph, although straight, does not show a proportional relationship. So, does this mean that not all straight-line graphs are proportional? Do we just need to check all the time or sometimes guess which ones could be proportional or not?
There is one difference between the two graphs and it's the fact that the second one does not pass through the origin. This point of ‘passing through the origin’ is a special characteristic of a proportional relationship because both quantities have to start from zero. If one is zero, the other has to be zero as well (since they are dependent on each other), otherwise the relationship is not proportional. So, a straight-line graph is only proportional if it passes through the origin. Easy to differentiate, right?
Are curved graphs proportional?
The following graph gives the number of copies of homework finished by Sammy after different hours spent on it.
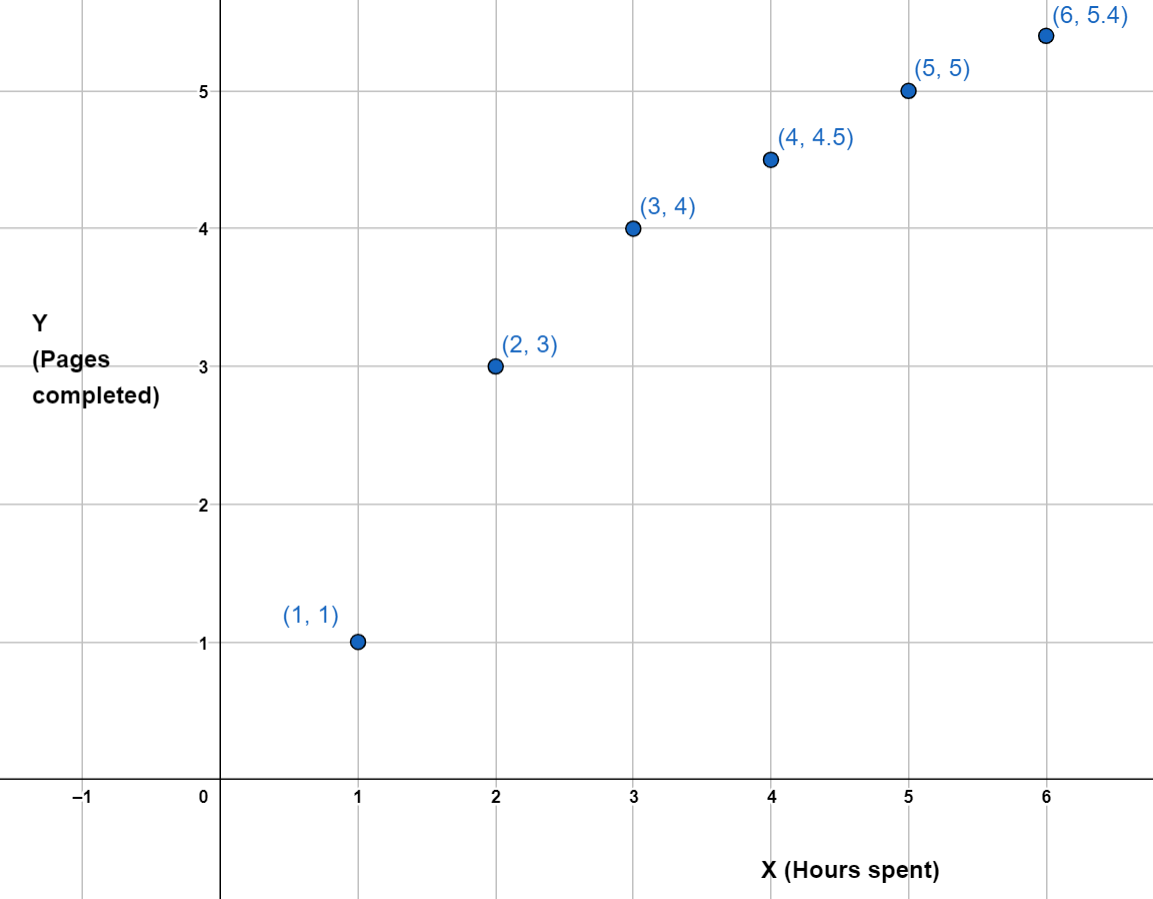
We have some ratios from the graph as follows: 1:1, 2:3, 3:4, 4:4.5, 5:5, etc.
They do not have the same relationships between the hours spent and the work finished. If it takes 1 hour to finish 1 page, it should take 2 hours to finding 2 pages for the relationships to be proportional and for the ratios to be equivalent. We could have easily concluded that the relationship between hours spent, and pages completed is not proportional since connecting the dots does not give a straight line.
Finding missing values from the graph
Making a graph from a ratio is pretty easy. You simply find equivalent ratios and plot them or use the equation to find more values of x and y, which are used as coordinates for the graph. Similarly, if you find one quantity on the graph, the other coordinate that lies on the line of the relationships is the missing value. For example, look at the graph below:
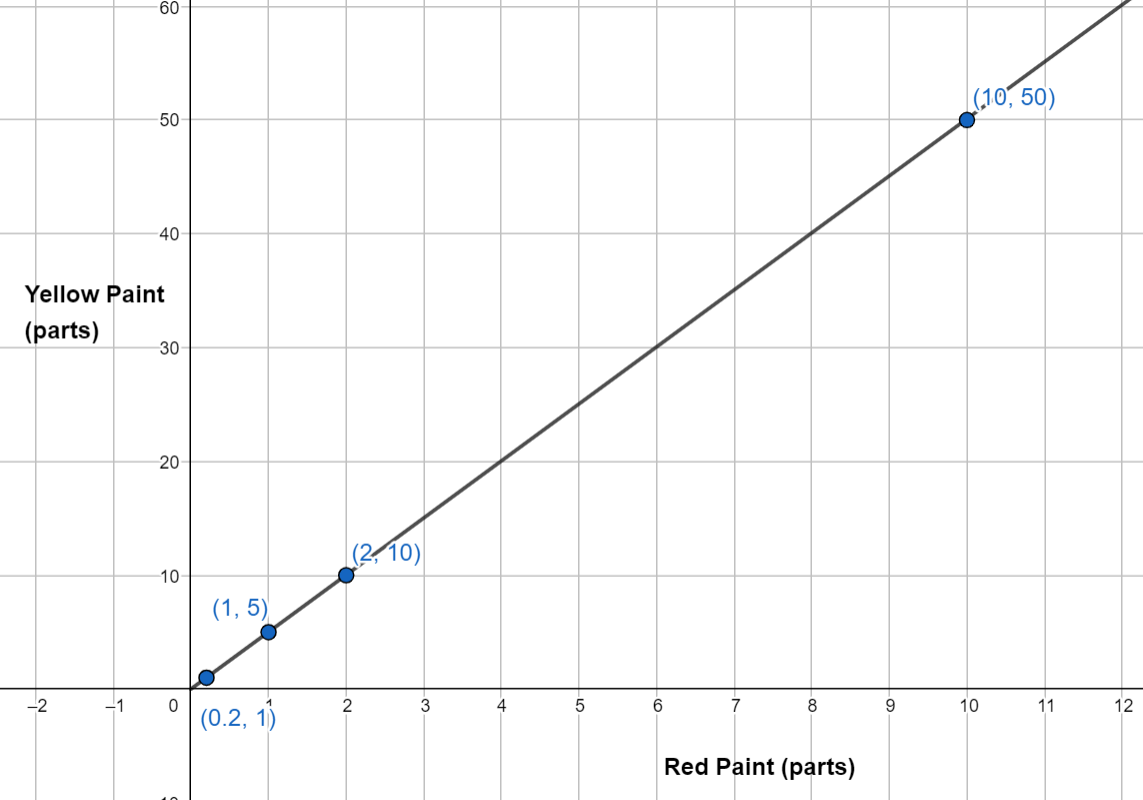
If you know the red paint is 8 parts, we can see where 8 lies on the line as the x coordinate and find it corresponding y coordinate on the line, which is 40.
So, the two points about a proportional relationship graph are:
Points that satisfy the relationship, meaning equivalent ratios, lie on a straight line.
The line that they lie on passes through the origin, (0,0).